



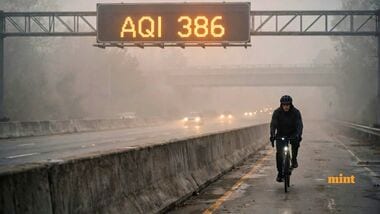
Delhi’s Air Quality Index (AQI) stood at 386 on Sunday, 22 November at 8:31 AM. The reading fell in the hazardous category on the US AQI scale. Smoky haze accompanied the morning pollution in the capital. New Delhi ranked 14th among the world’s most polluted cities in this morning’s rankings.
The temperature was 18°C at the time of the reading. Humidity stood at 67%, and the wind speed was 3.6 km/h. The ultraviolet index was 0.5. On the US scale used for the morning update, the hazardous category starts at 301. Delhi’s reading was 85 points above that mark.
Delhi’s PM2.5 concentration stood at 267 micrograms per cubic metre. PM10 measured 374 micrograms per cubic metre, a difference of 107 micrograms per cubic metre. Carbon monoxide was measured at 2,105 parts per billion. Nitrogen dioxide stood at 16 parts per billion. Sulphur dioxide measured six parts per billion, and ozone measured two.
Delhi had the highest among 8 Indian metros in the morning comparison. Chennai was next at 240, which was 146 points below Delhi. Mumbai recorded 210, Pune recorded 207, and Bengaluru recorded 205.
Ahmedabad stood at 195, and Hyderabad recorded 171. Kolkata had the lowest reading among the 8 metros, at 109. Delhi’s reading was 277 points higher than Kolkata’s. Four of the other 7 metros recorded readings above 200.
had eased over the three days before Sunday’s morning reading. It stood at 353 on November 19 and fell to 341 on the 20th. The figure dropped further to 313 on the following day.
That was a 40-point fall over two days. Sunday’s live reading was 73 points above Saturday’s daily figure.
Earlier, Delhi recorded 666 on November 9 and 547 on November 12. The November 9 figure was the highest daily reading through November 21.
The lowest was 224 on November 17, followed by 273 on November 18. Delhi recorded an AQI above 300 on 18 of the first 21 days of November. All three days below 300 fell between November 15 and 18.
Using Berkeley Earth’s method, the AQI.in tracker estimated exposure equivalent to smoking 8.7 cigarettes daily. The calculation used the average PM2.5 concentration over the previous 24 hours. It assumed continuous exposure to that air throughout the period.
At that rate, a week of continuous exposure would be equivalent to 60.9 cigarettes. The weekly figure is an estimate. The live AQI of 386 describes the at the morning update.