



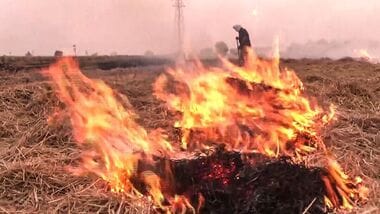
The primary driver pushing Delhi’s air quality into the “very poor” category on Monday was smoke from evening farm fires in Punjab and Haryana, according to an analysis of weather, air-quality, and satellite data by HT.
Delhi’s Air Quality Index (AQI) surged from 117 on Saturday to 261 on Sunday. By Monday’s 4 PM bulletin, the index hit 324—crossing the 300-mark threshold for “very poor” air for the first time this season, a level not recorded since February 11, HT reported.
While stagnant weather conditions played a role, HT’s data comparison indicated that meteorological factors alone do not explain the sudden deterioration in Delhi’s air quality.
Measures including afternoon wind clearance, HT found that dawn inversion strength, and night stillness were just as severe, if not worse, on October 18 and 28. However, the air on those nights remained significantly cleaner.
On the night of November 1 (10 PM to 6 AM Monday), PM2.5 levels averaged 194 micrograms per cubic metre—more than three times India’s safe limit of 60. By contrast, the October 18 and 28 nights averaged 68 and 127, respectively.
HT noted that trapped overnight pollution typically dissipates by mid-afternoon as the sun warms the ground.
While PM2.5 dropped by up to two-thirds on the October dates, pollution levels on November 1 did not fall at all. Instead, PM2.5 levels nearly doubled in three hours around midday on October 31—the sharpest midday rise this season—indicating a fresh influx of dirty air from outside the capital.
The HT analysis highlighted a major shift in crop-burning patterns that standard monitoring systems miss. The most frequently cited stubble burning metric comes from a NASA satellite that passes over Punjab at 1:30 PM.
However, farmers are now predominantly lighting fires later in the day.
According to a 2025 report by the New Delhi research group iFOREST cited by HT, over 90% of large fires in Punjab during 2024 and 2025 were lit after 3 PM, a massive jump from just 3% in 2021.
Analysing data from India’s geostationary INSAT-3DS satellite, which scans continuously through the day, HT found that evening fire counts surged from 17 on October 29 to 90 on November 1.
Because INSAT-3DS only detects larger fires, the actual number of burning fields is likely much higher, the publication noted.
The composition of the air also directly points to smoke — HT found that fine particles, characteristic of smoke rather than coarse road dust, made up nearly 60% of the total particulate matter by weight on the night of November 1, compared to roughly 40% on the October nights.
HT used Safdarjung balloon readings and global weather models to track transport-level winds, which carry pollution over long distances. On the afternoons of October 31 and November 1, these winds blew directly from the northwest fire belt.
Tracking the air’s three-day trajectory, HT found that the air arriving on November 1 had spent most of its time over Punjab and Haryana, passing over dozens of fires. Conversely, on October 28, the wind arrived from the south and east, avoiding the fire belt entirely.
While high humidity (over 90%) on the nights of October 31 and November 1 may have helped convert gases into fine particles, HT concluded that the afternoon air on November 1 was disproportionately dirty, directly linking the severe pollution spike to incoming smoke from neighbouring states.