



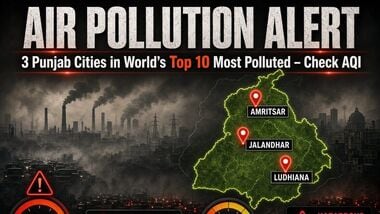
Amritsar, Bathinda and Faridkot in Punjab were among the five most polluted cities in India, according to real-time Air Quality Index (AQI) rankings. Amritsar recorded an AQI of 392, followed by Bathinda at 368 and Faridkot at 360.
Meerut in Uttar Pradesh and Fatehpur rounded out the top five, with AQI readings of 355 and 354, respectively.
Meanwhile, Delhi continued to record ‘poor’ air quality on Friday, with an AQI of 230. The capital’s air quality is expected to remain in the ‘poor’ category over the next nine days, according to the Air Quality Early Warning System.
These rankings are time-sensitive and can change as pollution levels and weather conditions fluctuate.
Delhi recorded an AQI of 230 on Friday, placing it in the ‘poor’ category. According to data from the Central Pollution Control Board’s (CPCB) Sameer app, three of the capital’s 56 monitoring stations recorded ‘very poor’ air quality.
Pusa recorded the highest AQI among the monitoring stations, at 324. Meanwhile, 36 stations reported ‘poor’ air quality, while the remaining 17 recorded ‘moderate’ conditions.
The Air Quality Early Warning System has forecast that Delhi’s air quality will remain ‘poor’ from October 23 to October 26 and is likely to stay in the same category for the following six days.
Weather conditions are expected to remain unfavourable for the dispersal of pollutants. According to the forecast, a ventilation index below 6,000 square metres per second, combined with an average wind speed of less than 10 kmph, can hinder the dispersion of pollutants.
Such conditions can allow pollutants to accumulate near the surface, prolonging periods of poor air quality.
According to the Decision Support System for Air Quality Management in Delhi, developed by IITM Pune, the transport sector accounted for 20.3% of the capital’s air pollution.
Other identified sources included:
Pollution source Contribution
Transport 20.3%
Residential sources 5.2%
Stubble burning 5.1%
Industries 4.2%
Construction 2.6%
Energy 2.0%
Waste burning 1.8%
Road dust 1.4%
Other sectors 1.3%
The data also showed that neighbouring National Capital Region (NCR) districts contributed to Delhi’s pollution. Gurugram accounted for the highest share among the listed districts, at 8.8%, followed by Jhajjar at 6.1% and Gautam Buddha Nagar at 4.7%.
Ghaziabad contributed 3.7%, Sonipat 3.5% and Faridabad 3.3%. Other contributors included Panipat at 2.8%, Alwar at 2.4%, Baghpat at 2.1%, Rohtak at 2%, Rewari at 1.8%, Bulandshahr and Bhiwani at 0.8% each, Mahendragarh at 0.7% and Karnal at 0.6%.
Stubble burning accounted for 5.1% of Delhi’s pollution, while other sources contributed 9.5%, according to the assessment.
The India Meteorological Department (IMD) reported that Delhi’s maximum temperature at Safdarjung, the city’s base weather station, settled at 32.2 degrees Celsius on Friday, while the minimum was 19 degrees Celsius.
At other stations, Palam recorded a maximum of 29.8 degrees Celsius and a minimum of 18.3 degrees Celsius. Lodhi Road registered a high of 32 degrees Celsius and a low of 18.6 degrees Celsius.
The Ridge station recorded a maximum of 31.3 degrees Celsius and a minimum of 19.2 degrees Celsius, while Ayanagar reported a high of 31.6 degrees Celsius and a low of 19.1 degrees Celsius.
The IMD has forecast partly cloudy skies for Saturday, with the maximum temperature likely to reach 33 degrees Celsius and the minimum expected to be around 19 degrees Celsius.
The AQI indicates the level of air pollution and its potential implications for health. The categories used in India are:
AQI range Category
0–50 Good
51–100 Satisfactory
101–200 Moderate
201–300 Poor
301–400 Very poor
401–500 Severe
(With PTI inputs)